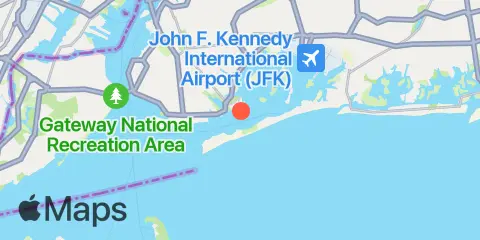
Barren Island Tides
Tide Chart
About this chart
 High fish activity
 Very high fish activity
Barren Island tide chart key:
The tide chart above shows the times and heights of high tide and low tide for Barren Island, as well as solunar period times (represented by fish icons). The red line highlights the current time and estimated height.Two fish mark minor solunar periods (high fish activity); four fish mark major solunar periods (very high fish activity).
Tide Times & Heights
| Tide | Time | Height |
|---|---|---|
| High tide | 4.80′ | |
| Low tide | 0.42′ | |
| High tide | 4.00′ | |
| Low tide | 0.30′ |
Tidal range for : 4.5 ft (minimum 0.3 ft, maximum 4.8 ft).
Tidal range for : 4.5 ft (minimum 0.3 ft, maximum 4.8 ft).
Local times Heights in ft relative to MLLW
Weather & Marine Forecast
Friday, January 29, 2027
Forecast unavailable for this selection.
| Date | Sun, Nov 22 | Mon, Nov 23 | Tue, Nov 24 | Wed, Nov 25 | Thu, Nov 26 | Fri, Nov 27 | Sat, Nov 28 | |||||||||||||||||||||||||||||||||||||||||||||||||||||||||
|---|---|---|---|---|---|---|---|---|---|---|---|---|---|---|---|---|---|---|---|---|---|---|---|---|---|---|---|---|---|---|---|---|---|---|---|---|---|---|---|---|---|---|---|---|---|---|---|---|---|---|---|---|---|---|---|---|---|---|---|---|---|---|---|---|
| Forecast | ||||||||||||||||||||||||||||||||||||||||||||||||||||||||||||||||
| Weather °F Precip |
58°
47%
|
58°
62%
|
58°
61%
|
58°
68%
|
57°
74%
|
57°
67%
|
57°
44%
|
57°
37%
|
57°
22%
|
57°
12%
|
57°
12%
|
57°
9%
|
56°
7%
|
55°
8%
|
56°
6%
|
58°
6%
|
60°
4%
|
62°
5%
|
63°
6%
|
64°
6%
|
63°
|
60°
|
56°
|
53°
|
50°
|
48°
|
47°
|
46°
|
45°
|
45°
|
46°
|
44°
|
43°
|
45°
|
47°
|
46°
|
43°
|
40°
|
39°
|
42°
|
45°
|
48°
|
49°
|
49°
5%
|
49°
30%
|
48°
30%
|
49°
68%
|
52°
68%
|
54°
75%
|
58°
75%
|
59°
69%
|
56°
47%
|
56°
47%
|
54°
28%
|
51°
28%
|
50°
19%
|
50°
19%
|
50°
10%
|
50°
2%
|
49°
2%
|
49°
5%
|
50°
5%
|
51°
10%
|
50°
10%
|
| Wind mph | 8 Gust 16 | 11 Gust 16 | 12 Gust 19 | 11 Gust 17 | 11 Gust 17 | 12 Gust 23 | 12 Gust 22 | 13 Gust 26 | 12 Gust 21 | 9 Gust 17 | 10 Gust 19 | 8 Gust 16 | 5 Gust 13 | 5 Gust 10 | 8 Gust 15 | 10 Gust 18 | 8 Gust 17 | 8 Gust 14 | 8 Gust 14 | 9 Gust 16 | 8 Gust 17 | 12 Gust 22 | 10 Gust 22 | 10 Gust 26 | 11 Gust 26 | 12 Gust 27 | 12 Gust 26 | 10 Gust 22 | 9 Gust 23 | 10 Gust 20 | 15 Gust 20 | 18 Gust 23 | 19 Gust 25 | 18 Gust 19 | 17 Gust 17 | 13 Gust 12 | 11 Gust 11 | 12 Gust 15 | 12 Gust 14 | 13 Gust 14 | 13 Gust 13 | 14 Gust 15 | 20 Gust 18 | 21 Gust 21 | 24 Gust 28 | 29 Gust 36 | 31 Gust 42 | 37 Gust 52 | 42 Gust 57 | 40 Gust 57 | 17 Gust 30 | 12 Gust 18 | 18 Gust 26 | 26 Gust 33 | 28 Gust 35 | 28 Gust 35 | 27 Gust 35 | 23 Gust 32 | 18 Gust 28 | 18 Gust 26 | 16 Gust 22 | 14 Gust 17 | 14 Gust 15 | 9 Gust 12 |
| Waves | 2.9′ 6.3 sec | 3.1′ 6.4 sec | 3.1′ 6.5 sec | 3.3′ 6.8 sec | 3.3′ 7 sec | 3.5′ 7.3 sec | 3.6′ 7.6 sec | 3.7′ 7.9 sec | 3.9′ 8.2 sec | 4.1′ 8.5 sec | 4.2′ 8.7 sec | 4.3′ 8.9 sec | 4.4′ 9 sec | 4.5′ 9.1 sec | 4.5′ 9.2 sec | 4.7′ 9.2 sec | 4.7′ 9.3 sec | 4.7′ 9.3 sec | 4.7′ 9.2 sec | 4.7′ 9.2 sec | 4.5′ 9.1 sec | 4.4′ 9.1 sec | 4.3′ 9 sec | 4.2′ 8.7 sec | 4.1′ 8.3 sec | 4′ 8.1 sec | 3.8′ 8 sec | 3.7′ 8.1 sec | 3.5′ 8.1 sec | 3.3′ 8.2 sec | 3′ 8.4 sec | 2.8′ 7.8 sec | 2.7′ 7.4 sec | 2.4′ 7.7 sec | 2.2′ 8 sec | 2′ 7.8 sec | 1.9′ 7.6 sec | 2.1′ 6.8 sec | 2.3′ 6.5 sec | 2.5′ 6.2 sec | 2.6′ 6.3 sec | 2.9′ 5.8 sec | 3.5′ 5.3 sec | 4.1′ 5.5 sec | 5.1′ 6 sec | 5.7′ 6.4 sec | 6.5′ 7 sec | 7.6′ 7.5 sec | 9′ 8 sec | 9.7′ 8.3 sec | 9′ 8.9 sec | 8.1′ 9.4 sec | 7.2′ 9.5 sec | 6.4′ 9.7 sec | 5.6′ 9.8 sec | 4.9′ 9.7 sec | 4.1′ 9.6 sec | 3.4′ 9.7 sec | 2.6′ 9.8 sec | 2.4′ 9.6 sec | 2.1′ 9.5 sec | 1.9′ 9.6 sec | 1.8′ 9.6 sec | 1.6′ 9.5 sec |
| Swell | 2.7′ 6 sec | 2.8′ 6.1 sec | 3′ 6.1 sec | 3.1′ 6.2 sec | 3.2′ 6.3 sec | 3.4′ 6.4 sec | 3.5′ 6.5 sec | 3.7′ 6.7 sec | 3.5′ 7.3 sec | 3.3′ 8.1 sec | 3.1′ 8.5 sec | 3.5′ 8.4 sec | 4′ 8 sec | 4.5′ 7.6 sec | 4.5′ 7.6 sec | 4.6′ 7.6 sec | 4.7′ 7.7 sec | 4.6′ 7.8 sec | 4.6′ 7.9 sec | 4.5′ 7.9 sec | 4.4′ 7.9 sec | 4.3′ 7.8 sec | 4.1′ 7.8 sec | 4′ 7.7 sec | 3.8′ 7.7 sec | 3.7′ 7.7 sec | 3.5′ 7.6 sec | 3.3′ 7.6 sec | 3.2′ 7.6 sec | 3.1′ 7.6 sec | 2.4′ 7.3 sec | 2′ 7.1 sec | 2.1′ 7.1 sec | 2.2′ 7.3 sec | 2′ 7.4 sec | 1.9′ 7.4 sec | 1.8′ 7.5 sec | 1.7′ 7.8 sec | 1.7′ 7.9 sec | 1.7′ 8.3 sec | 1.7′ 5.3 sec | 1.6′ 6.6 sec | 1.8′ 5.2 sec | 2.6′ 5.2 sec | 3.4′ 6.4 sec | 4.2′ 6.2 sec | 4.9′ 6.5 sec | 5.4′ 7.6 sec | 5.8′ 8.4 sec | 5.4′ 8.6 sec | 5.2′ 8.7 sec | 7.4′ 8.6 sec | 6.8′ 8.6 sec | 6.2′ 8.6 sec | 5.5′ 8.5 sec | 4.8′ 8.5 sec | 4.1′ 8.4 sec | 3.1′ 8.3 sec | 2.6′ 8.3 sec | 2.3′ 8.3 sec | 2.1′ 8.2 sec | 1.9′ 8.1 sec | 1.7′ 8.1 sec | 1.6′ 8 sec |
| Water °F | 58° | 58° | 58° | 58° | 58° | 58° | 58° | 58° | 58° | 58° | 58° | 58° | 58° | 58° | 58° | 58° | 58° | 58° | 58° | 58° | 58° | 58° | 58° | 58° | 58° | 58° | 58° | 58° | 57° | 57° | 57° | 57° | 57° | 57° | 57° | 57° | 57° | 56° | 56° | 56° | 56° | 56° | 56° | 56° | 56° | 56° | 56° | 56° | 56° | 56° | 56° | 56° | 56° | 56° | 56° | 56° | 56° | 53° | 53° | 53° | 53° | 53° | 53° | 52° |
Wave / swell fill scale: 0–10 ft
About this forecast
Wave forecasts represent open-water conditions; conditions in rivers, harbors, and sheltered waters may differ. Forecast wave heights represent significant wave height, roughly the average height of the highest third of waves. Individual waves can be twice this height or more, so the forecast does not represent the maximum wave height.
Sun, Moon & Fishing Times
Moon phase
 Last Quarter
50% illuminated
Sun & moon
- Sunrise
- Sunset
- Moonrise
- Moonset
Next 7 Days
| Day | 1st Tide | 2nd Tide | 3rd Tide | 4th Tide | ☀ Sun | Moon phase |
Major Times
|
Minor Times
|
|---|---|---|---|---|---|---|---|---|
|
4.8 ft
|
0.42 ft
|
4 ft
|
0.3 ft
|
7:08 AM 5:09 PM |
50%
|
4:41 AM → 6:41 AM 5:05 PM → 7:05 PM |
12:09 AM → 1:09 AM 10:06 AM → 11:06 AM |
|
|
4.61 ft
|
0.58 ft
|
3.7 ft
|
0.52 ft
|
7:07 AM 5:10 PM |
 38% |
5:30 AM → 7:30 AM 5:54 PM → 7:54 PM |
1:15 AM → 2:15 AM 10:39 AM → 11:39 AM |
|
|
4.46 ft
|
0.58 ft
|
3.52 ft
|
0.59 ft
|
7:06 AM 5:12 PM |
29%
|
6:19 AM → 8:19 AM 6:45 PM → 8:45 PM |
2:18 AM → 3:18 AM 11:17 AM → 12:17 PM |
|
|
4.41 ft
|
0.49 ft
|
3.5 ft
|
0.54 ft
|
7:05 AM 5:13 PM |
21%
|
7:10 AM → 9:10 AM 7:36 PM → 9:36 PM |
3:17 AM → 4:17 AM 12:02 PM → 1:02 PM |
|
|
4.48 ft
|
0.33 ft
|
3.64 ft
|
0.41 ft
|
7:04 AM 5:14 PM |
13%
|
8:01 AM → 10:01 AM 8:27 PM → 10:27 PM |
4:10 AM → 5:10 AM 12:54 PM → 1:54 PM |
|
|
4.65 ft
|
0.14 ft
|
3.86 ft
|
0.26 ft
|
7:03 AM 5:15 PM |
8%
|
8:52 AM → 10:52 AM 9:17 PM → 11:17 PM |
4:55 AM → 5:55 AM 1:52 PM → 2:52 PM |
|
|
4.84 ft
|
-0.06 ft
|
4.09 ft
|
— | 7:02 AM 5:16 PM |
3%
|
9:41 AM → 11:41 AM 10:04 PM → 12:04 AM |
5:33 AM → 6:33 AM 2:53 PM → 3:53 PM |
Location & Map
Nearby
About these predictions
Tide heights are predictions, not measurements. Wind, air pressure, storms, and river flow can cause actual water levels to differ. Not for navigation.
Tide prediction source:
Tide predictions: NOAA Center for Operational Oceanographic Products and Services (CO-OPS). Official source
Vertical datum:
MLLW — Mean Lower Low Water
Weather Data: NOAA & Open-Meteo
Add a free tide or fishing times widget for this station to your website.