Callawassie Island Bridge Weekly Tide Tables and Charts
Tide Chart for Next 7 Days
Callawassie Island Bridge weekly tide chart key:
The tide chart above shows the times and heights of high tide and low tide for Callawassie Island Bridge, for the next seven days. The red line highlights the current time and estimated height.The tidal range at Callawassie Island Bridge for the next seven days is approximately 8.24 ft with a minimum tide of 0.13 ft and maximum tide of 8.37 ft. You can also check out all the daily details on tides & fishing times on the Day tab for Callawassie Island Bridge.
Tide Table for Next 7 Days
▲ Blue = High Tide
▼ Red = Low Tide
| Day | 1st Tide | 2nd Tide | 3rd Tide | 4th Tide | ☀ Sun |
Major Solunars
|
Minor Solunars
|
|
|---|---|---|---|---|---|---|---|---|
| 30 Thu |
|
▼ 0.49 ft |
▲ 7.27 ft |
▼ 0.44 ft |
▲ 8.32 ft |
▲ 6:37 AM ▼ 8:22 PM |
1:01 AM → 3:01 AM 1:19 PM → 3:19 PM |
6:56 AM → 7:56 AM 8:42 PM → 9:42 PM |
| 31 Fri |
|
▼ 0.36 ft |
▲ 7.39 ft |
▼ 0.46 ft |
▲ 8.22 ft |
▲ 6:38 AM ▼ 8:22 PM |
1:45 AM → 3:45 AM 2:03 PM → 4:03 PM |
7:55 AM → 8:55 AM 9:11 PM → 10:11 PM |
| 1 Sat |
|
▼ 0.25 ft |
▲ 7.53 ft |
▼ 0.54 ft |
▲ 8.06 ft |
▲ 6:38 AM ▼ 8:21 PM |
2:29 AM → 4:29 AM 2:46 PM → 4:46 PM |
8:54 AM → 9:54 AM 9:38 PM → 10:38 PM |
| 2 Sun |
|
▼ 0.17 ft |
▲ 7.69 ft |
▼ 0.67 ft |
▲ 6:39 AM ▼ 8:20 PM |
3:11 AM → 5:11 AM 3:29 PM → 5:29 PM |
9:53 AM → 10:53 AM 10:05 PM → 11:05 PM |
|
| 3 Mon |
|
▲ 7.87 ft |
▼ 0.13 ft |
▲ 7.88 ft |
▼ 0.86 ft |
▲ 6:40 AM ▼ 8:19 PM |
3:55 AM → 5:55 AM 4:13 PM → 6:13 PM |
10:53 AM → 11:53 AM 10:33 PM → 11:33 PM |
| 4 Tue |
|
▲ 7.65 ft |
▼ 0.14 ft |
▲ 8.07 ft |
▼ 1.06 ft |
▲ 6:40 AM ▼ 8:18 PM |
4:40 AM → 6:40 AM 5:00 PM → 7:00 PM |
11:56 AM → 12:56 PM 11:05 PM → 12:05 AM |
| 5 Wed |
|
▲ 7.43 ft |
▼ 0.19 ft |
▲ 8.28 ft |
▼ 1.23 ft |
▲ 6:41 AM ▼ 8:18 PM |
5:29 AM → 7:29 AM 5:51 PM → 7:51 PM |
1:02 PM → 2:02 PM |
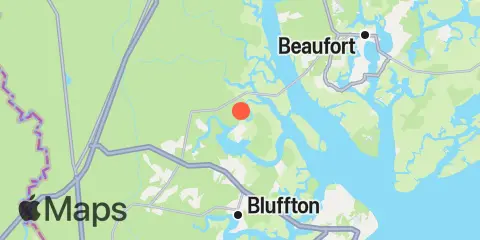
Location & Map
Latitude
32° 20' 30" N (32.3417)
Longitude
80° 51' 24" W (-80.8567)
State
County
Nearest ZIP
29909
Nearby
Tides
1.9 mi
Callawassie Creek, Colleton River
2.0 mi
Callawassie Island, south, Colleton River
2.0 mi
Baileys Landing, Okatee River, Colleton River
2.5 mi
Chechessee Bluff, Chechessee River
4.0 mi
Colleton River Entrance
5.0 mi
Broughton Point, Hazzard Creek, Broad River
5.6 mi
Hwy. 170 bridge, Broad River
6.5 mi
Euhaw Creek, 2.5 mi. above entrance, Broad River
7.7 mi
Pinckney Island, Mackay Creek, Chechessee River
7.7 mi
Bluffton, May River
8.7 mi
Skull Creek, Ribaut Island
8.8 mi
Brighton Beach, May River
9.6 mi
Skull Creek, south entrance, Hilton Head Island
10.1 mi
Bull Island North, May River
10.4 mi
Battery Creek, 4 mi. above entrance, Beaufort River
10.5 mi
Albergottie Creek, Rt. 21 bridge, Beaufort River
10.8 mi
Savage I., Savage Creek, Bull Creek
11.0 mi
Parris Island, Marine Corps Recruit Depot, Beaufort River
11.3 mi
Pilot Island, West Branch Boyds Creek, Broad River
11.6 mi
Rt. 170 bridge, New River
11.7 mi
Moreland Cemetery, May River
11.9 mi
Clarendon Plantation
12.2 mi
Bull Creek, Bull Island South, Cooper River
12.2 mi
Beaufort, Beaufort River
12.4 mi
Broad Creek, Hilton Head Island
Currents
3.0 mi
Lemon Island South, Chechessee River
5.4 mi
Broad River Bridge, S of, Broad River
7.6 mi
Daws Island, south of, Chechessee River
8.2 mi
Daws Island, SE of, Broad River
8.3 mi
Boyd Creek Entrance, SE of, Broad River
8.6 mi
Skull Creek, north entrance
9.0 mi
Parris Island Lookout Tower, Broad River
9.2 mi
Skull Creek, south entrance
9.3 mi
MacKay Creek, south entrance
10.7 mi
Parris Island, north of, Beaufort River
11.5 mi
Spanish Wells, Calibogue Sound
11.6 mi
Burkmeyer Bech, Beaufort River
11.7 mi
Parris Island, east of, Beaufort River
11.8 mi
Little Barnwell I., E of, Whale Branch River
12.2 mi
Beaufort, Beaufort River
Note: Tide predictions are an estimate and NOT FOR NAVIGATION.
We also offer free widgets if you want to add tide or solunar tables to your own site.