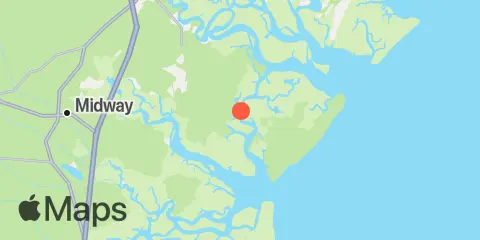
Bear River Weekly Tide Tables and Charts
Tide Chart for Next 7 Days
About this chart
Bear River weekly tide chart key:
The tide chart above shows the times and heights of high tide and low tide for Bear River, for the next seven days. The red line highlights the current time and estimated height.The tidal range at Bear River from through is approximately 9.59 ft, with a minimum tide of -0.15 ft and maximum tide of 9.44 ft. You can also check out all the daily details on tides & fishing times on the Day tab for Bear River.
Tide Table for Next 7 Days
▲ Blue = High Tide
▼ Red = Low Tide
| Day | Moon phase | 1st Tide | 2nd Tide | 3rd Tide | 4th Tide | ☀ Sun |
Major Times

|
Minor Times

|
|---|---|---|---|---|---|---|---|---|
 89% |
▼ -0.15 ft |
▲ 9.44 ft |
▼ 0.21 ft |
▲ 7.75 ft |
▲ 7:39 AM ▼ 6:38 PM |
3:04 AM → 5:04 AM 3:35 PM → 5:35 PM |
11:07 AM → 12:07 PM 9:04 PM → 10:04 PM |
|
|
81%
|
▼ 0.12 ft |
▲ 9.08 ft |
▼ 0.49 ft |
▲ 7:40 AM ▼ 6:37 PM |
4:08 AM → 6:08 AM 4:41 PM → 6:41 PM |
12:09 PM → 1:09 PM 10:13 PM → 11:13 PM |
||
|
71%
|
▲ 7.49 ft |
▼ 0.46 ft |
▲ 8.68 ft |
▼ 0.77 ft |
▲ 7:40 AM ▼ 6:36 PM |
5:10 AM → 7:10 AM 5:42 PM → 7:42 PM |
1:01 PM → 2:01 PM 11:24 PM → 12:24 AM |
|
 50% |
▲ 7.31 ft |
▼ 0.8 ft |
▲ 8.3 ft |
▼ 0.96 ft |
▲ 6:41 AM ▼ 5:35 PM |
5:08 AM → 7:08 AM 5:38 PM → 7:38 PM |
12:45 PM → 1:45 PM | |
 48% |
▲ 7.27 ft |
▼ 1.07 ft |
▲ 7.98 ft |
▼ 1.02 ft |
▲ 6:42 AM ▼ 5:34 PM |
6:01 AM → 8:01 AM 6:29 PM → 8:29 PM |
11:32 PM → 12:32 AM 1:21 PM → 2:21 PM |
|
|
37%
|
▲ 7.37 ft |
▼ 1.17 ft |
▲ 7.76 ft |
▼ 0.94 ft |
▲ 6:43 AM ▼ 5:33 PM |
6:50 AM → 8:50 AM 7:17 PM → 9:17 PM |
12:38 AM → 1:38 AM 1:53 PM → 2:53 PM |
|
|
27%
|
▲ 7.61 ft |
▼ 1.12 ft |
▲ 7.64 ft |
▼ 0.8 ft |
▲ 6:44 AM ▼ 5:33 PM |
7:36 AM → 9:36 AM 8:02 PM → 10:02 PM |
1:41 AM → 2:41 AM 2:22 PM → 3:22 PM |
Location & Map
Latitude
31° 47' 36" N (31.7933)
Longitude
81° 10' 54" W (-81.1817)
State
County
Nearest ZIP
31324
Nearby
Tides
1.3 mi
Kilkenny Club, Kilkenny Creek
1.8 mi
Florida Passage, Bear River
2.5 mi
Cane Patch Creek entrance
4.6 mi
Florida Passage, Ogeechee River
5.4 mi
South Ossabaw Island, Bear River
6.0 mi
Sunbury, Sunbury Channel
6.4 mi
Egg Islands
6.6 mi
Fort McAllister, Ogeechee River
7.1 mi
Belfast, Belfast River
7.3 mi
Walburg Creek entrance
7.7 mi
North Newport River (Daymark 119)
8.0 mi
Bradley Point, Bradley River
8.6 mi
Halfmoon, Timmons River
9.7 mi
Little Wassaw Island, Green Island Sound
9.9 mi
Coffee Bluff, Forest River
10.1 mi
North Newport River
10.4 mi
Vernon View, Burnside River
11.3 mi
Thomas Landing, S. Newport River
12.1 mi
Richmond Hill, Ogeechee River
12.3 mi
Eagle Neck, South Newport River
Currents
1.2 mi
610 Statute Mile Mark
1.4 mi
North of Big Tom Creek Entrance
2.5 mi
South of Kilkenny Creek Entrance
2.9 mi
Florida Passage (south)
3.2 mi
Northwest of Newell Creek Entrance
4.1 mi
Medway River at Marsh Island
4.9 mi
Florida Passage, N of, Ogeechee River
5.5 mi
Medway River, northwest of Cedar Point
5.9 mi
St. Catherines Sound Entrance
7.1 mi
N. Newport River, NE of Vandyke Creek
7.5 mi
Raccoon Key & Egg Island Shoal, between
8.2 mi
Little Ogeechee River Entrance
8.3 mi
Little Don Island, east of, Vernon River
8.3 mi
N. Newport River, above Walburg Creek
8.8 mi
Vernon R., 1.2 miles S of Possum Point
8.8 mi
Little Ogeechee River Entrance, north of
8.8 mi
Raccoon Key
8.8 mi
Bradley Point, NNE of
9.2 mi
N. Newport River, NW of Johnson Creek
9.4 mi
Little Wassaw Island, SW of
10.1 mi
N. Newport River, ESE of S. Newport Cut
10.3 mi
Montgomery, Vernon River
10.7 mi
Burnside Island, SE of, Burnside River
11.1 mi
Wassaw Island, SSW of
11.5 mi
Johnson Creek, midway between ends
11.7 mi
Pigeon Island, SSE of, Skidaway River
11.9 mi
S. Newport River, above Swain River Ent
11.9 mi
Odingsell River Entrance
12.2 mi
S. Newport River, below S. Newport Cut
12.2 mi
Long Island, south of, Skidaway River
About these predictions
Tide heights are predictions, not measurements. Wind, air pressure, storms, and river flow can cause actual water levels to differ. Not for navigation.
Tide prediction source:
NOAA
Vertical datum:
MLLW — Mean Lower Low Water
Add a free tide or fishing times widget for this station to your website.