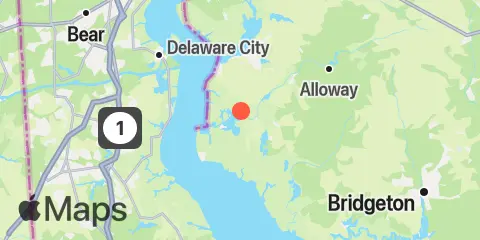
2.5 N.Mi. Above Entrance Weekly Tide Tables and Charts
Tide Chart for Next 7 Days
About this chart
2.5 N.Mi. Above Entrance weekly tide chart key:
The tide chart above shows the times and heights of high tide and low tide for 2.5 N.Mi. Above Entrance, for the next seven days. The red line highlights the current time and estimated height.The tidal range at 2.5 N.Mi. Above Entrance from through is approximately 5.45 ft, with a minimum tide of 0.28 ft and maximum tide of 5.73 ft. You can also check out all the daily details on tides & fishing times on the Day tab for 2.5 N.Mi. Above Entrance.
Tide Table for Next 7 Days
▲ Blue = High Tide
▼ Red = Low Tide
| Day | Moon phase | 1st Tide | 2nd Tide | 3rd Tide | 4th Tide | ☀ Sun |
Major Times

|
Minor Times

|
|---|---|---|---|---|---|---|---|---|
 95% |
▲ 4.87 ft |
▼ 0.28 ft |
▲ 5.73 ft |
▼ 0.37 ft |
▲ 7:26 AM ▼ 6:05 PM |
1:36 AM → 3:36 AM 2:06 PM → 4:06 PM |
10:00 AM → 11:00 AM 7:12 PM → 8:12 PM |
|
|
89%
|
▲ 4.73 ft |
▼ 0.37 ft |
▲ 5.64 ft |
▼ 0.48 ft |
▲ 7:27 AM ▼ 6:04 PM |
2:40 AM → 4:40 AM 3:12 PM → 5:12 PM |
11:11 AM → 12:11 PM 8:13 PM → 9:13 PM |
|
|
81%
|
▲ 4.58 ft |
▼ 0.48 ft |
▲ 5.48 ft |
▼ 0.58 ft |
▲ 7:28 AM ▼ 6:03 PM |
3:44 AM → 5:44 AM 4:17 PM → 6:17 PM |
12:11 PM → 1:11 PM 9:24 PM → 10:24 PM |
|
|
71%
|
▲ 4.46 ft |
▼ 0.58 ft |
▲ 5.29 ft |
▼ 0.62 ft |
▲ 7:29 AM ▼ 6:01 PM |
4:47 AM → 6:47 AM 5:19 PM → 7:19 PM |
1:00 PM → 2:00 PM 10:38 PM → 11:38 PM |
|
 50% |
▲ 4.41 ft |
▼ 0.63 ft |
▲ 5.14 ft |
▼ 0.59 ft |
▲ 6:30 AM ▼ 5:00 PM |
4:44 AM → 6:44 AM 5:16 PM → 7:16 PM |
12:39 PM → 1:39 PM 10:53 PM → 11:53 PM |
|
 48% |
▲ 4.47 ft |
▼ 0.62 ft |
▲ 5.07 ft |
▲ 6:31 AM ▼ 4:59 PM |
5:38 AM → 7:38 AM 6:07 PM → 8:07 PM |
1:11 PM → 2:11 PM | ||
|
37%
|
▼ 0.48 ft |
▲ 4.63 ft |
▼ 0.54 ft |
▲ 5.06 ft |
▲ 6:32 AM ▼ 4:58 PM |
6:26 AM → 8:26 AM 6:54 PM → 8:54 PM |
12:04 AM → 1:04 AM 1:37 PM → 2:37 PM |
Location & Map
Latitude
39° 30' 18" N (39.505)
Longitude
75° 28' 60" W (-75.4833)
State
County
Nearest ZIP
08069
Nearby
Tides
0.7 mi
Abbots Meadow, Alloway Creek
1.9 mi
0.8 n.mi. above entrance, Alloway Creek
2.0 mi
Coopers Creek bridge, Alloway Creek
3.3 mi
Hope Creek, 0.6 n.mi. above entrance, Delaware River
4.0 mi
Artificial Island, Salem Nuclear Plant, Delaware River
4.6 mi
Sinnickson Landing, Salem River
4.7 mi
Quinton, Alloway Creek
5.0 mi
Salem, Salem River
5.2 mi
Canton, Stow Creek, Delaware River
5.4 mi
1 n.mi. above entrance, Mad Horse Creek
6.1 mi
Reedy Point, C&D Canal
6.5 mi
Pine Island, Malapartis Creek, Mad Horse Creek
7.2 mi
Pea Patch Island, Bulkhead Shoal Channel, Delaware River
7.3 mi
Delaware City Branch Channel bridge, Delaware River
7.7 mi
Delaware City, Delaware River
7.9 mi
Raccoon Ditch, Newport Meadows, Stow Creek, Delaware River
8.0 mi
Stathems Neck, Stow Creek, Delaware River
9.2 mi
Taylors Bridge, Blackbird Creek, Delaware River
9.5 mi
St. Georges, Chesapeake and Delaware Canal
11.0 mi
Greenwich Pier, Cohansey River, Delaware Bay
11.3 mi
New Castle, Delaware River
11.9 mi
Woodland Beach, Delaware River
12.4 mi
Salem Canal entrance, Delaware River
Currents
2.3 mi
New Bridge, Alloway Creek
2.3 mi
Alloway Creek ent., 0.2 mile above
3.8 mi
Reedy Island Wreck
3.9 mi
Reedy Island (off end of pier)
4.6 mi
Salem River entrance
4.7 mi
Salem River Entrance, east of marker 11
4.8 mi
Baker Range Channel
5.2 mi
Reedy Point
5.6 mi
Chesapeake and Delaware Canal Entrance
5.6 mi
Stony Point, channel west of
6.0 mi
Reedy Point Radio Tower, south of
6.6 mi
Appoquinimink River entrance
7.0 mi
Bulkhead Shoal Channel, SE, Del. City
7.3 mi
Pea Patch Island
7.7 mi
Bulkhead Shoal Channel, off Del. City
8.5 mi
Finns Point, 0.60 n.mi. Northwest of
8.9 mi
Arnold Point, 1.8 nm WSW of
9.2 mi
Penns Neck, 0.3 mile west of
9.4 mi
Penns Neck, 0.6 mile west of
9.5 mi
St. George Bridge, 0.1 n.mi. ENE of
9.8 mi
Smyrna River entrance
10.9 mi
Kelly Point, 0.7nm N of
12.0 mi
Conrail Bridge, east of
About these predictions
Tide heights are predictions, not measurements. Wind, air pressure, storms, and river flow can cause actual water levels to differ. Not for navigation.
Tide prediction source:
NOAA
Vertical datum:
MLLW — Mean Lower Low Water
Add a free tide or fishing times widget for this station to your website.