Fulton Weekly Tide Tables and Charts
Tide Chart for Next 7 Days
About this chart
Fulton weekly tide chart key:
The tide chart above shows the times and heights of high tide and low tide for Fulton, for the next seven days. The red line highlights the current time and estimated height.The tidal range at Fulton from through is approximately 4.68 ft, with a minimum tide of 0.17 ft and maximum tide of 4.85 ft. You can also check out all the daily details on tides & fishing times on the Day tab for Fulton.
Tide Table for Next 7 Days
▲ Blue = High Tide
▼ Red = Low Tide
| Day | Moon phase | 1st Tide | 2nd Tide | 3rd Tide | 4th Tide | ☀ Sun |
Major Times

|
Minor Times

|
|---|---|---|---|---|---|---|---|---|
 89% |
▼ 0.17 ft |
▲ 4.85 ft |
▼ 0.52 ft |
▲ 7:38 AM ▼ 6:41 PM |
3:05 AM → 5:05 AM 3:37 PM → 5:37 PM |
11:04 AM → 12:04 PM 9:10 PM → 10:10 PM |
||
|
81%
|
▲ 3.96 ft |
▼ 0.32 ft |
▲ 4.71 ft |
▼ 0.64 ft |
▲ 7:39 AM ▼ 6:40 PM |
4:09 AM → 6:09 AM 4:42 PM → 6:42 PM |
12:06 PM → 1:06 PM 10:19 PM → 11:19 PM |
|
|
71%
|
▲ 3.87 ft |
▼ 0.48 ft |
▲ 4.54 ft |
▼ 0.71 ft |
▲ 7:40 AM ▼ 6:39 PM |
5:12 AM → 7:12 AM 5:43 PM → 7:43 PM |
12:59 PM → 1:59 PM 11:28 PM → 12:28 AM |
|
 50% |
▲ 3.83 ft |
▼ 0.6 ft |
▲ 4.39 ft |
▼ 0.71 ft |
▲ 6:41 AM ▼ 5:38 PM |
5:09 AM → 7:09 AM 5:39 PM → 7:39 PM |
12:43 PM → 1:43 PM | |
 48% |
▲ 3.86 ft |
▼ 0.65 ft |
▲ 4.29 ft |
▼ 0.65 ft |
▲ 6:41 AM ▼ 5:38 PM |
6:02 AM → 8:02 AM 6:31 PM → 8:31 PM |
11:36 PM → 12:36 AM 1:21 PM → 2:21 PM |
|
|
37%
|
▲ 3.97 ft |
▼ 0.64 ft |
▲ 4.23 ft |
▼ 0.56 ft |
▲ 6:42 AM ▼ 5:37 PM |
6:51 AM → 8:51 AM 7:18 PM → 9:18 PM |
12:41 AM → 1:41 AM 1:53 PM → 2:53 PM |
|
|
27%
|
▲ 4.14 ft |
▼ 0.59 ft |
▲ 4.2 ft |
▼ 0.47 ft |
▲ 6:43 AM ▼ 5:36 PM |
7:37 AM → 9:37 AM 8:03 PM → 10:03 PM |
1:43 AM → 2:43 AM 2:23 PM → 3:23 PM |
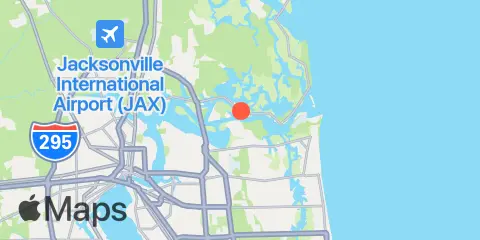
Location & Map
Latitude
30° 23' 24" N (30.39)
Longitude
81° 30' 24" W (-81.5067)
State
County
Nearest ZIP
32225
Nearby
Tides
1.2 mi
Clapboard Creek, Pelotes Island
2.8 mi
Blount Island Bridge
3.1 mi
Dame Point, St. Johns River
3.6 mi
Pablo Creek entrance
3.7 mi
Sisters Creek
4.5 mi
Mayport (Ferry Depot)
4.7 mi
Bar Pilot Dock, St. Johns River
5.3 mi
Fort George Island, Fort George River
5.6 mi
Water Treatment Dock, Mayport Naval Station, St Johns River
6.2 mi
Pablo Creek, ICWW bridge
6.7 mi
Little Talbot Island, Ocean
6.7 mi
Degaussing structure, Mayport Naval Station
6.8 mi
Simpson Creek, A1A highway bridge
7.1 mi
Jacksonville, Long Branch
7.2 mi
Jacksonville, Navy Fuel Depot
7.7 mi
Atlantic Beach
7.8 mi
Tiger Point, Pumpkin Hill Creek, Nassau River
7.8 mi
Phoenix Park
8.0 mi
Edwards Creek, Nassau River
8.1 mi
Sawpit Creek, 1 mi. above entrance
8.3 mi
Little Pottsburg Creek
8.7 mi
Cedar Heights, Broward River
9.0 mi
Sawpit Creek entrance, bridge
9.2 mi
Moncrief Creek entrance, Trout River
9.4 mi
Nassau River entrance
10.3 mi
Main Street Bridge, St. Johns River
10.3 mi
Jacksonville Beach
10.5 mi
Oak Landing, ICWW
11.1 mi
Mink Creek entrance, Nassau River
11.4 mi
Lake Forest, Ribault River, Trout River
12.3 mi
Nassauville, Nassau River East
Currents
0.2 mi
Blount Island, East of
0.6 mi
St. Johns Bluff
2.7 mi
Sisters Creek entrance (bridge)
2.8 mi
Dames Point, 0.23 n.mi. ESE of
3.1 mi
Dames Point Bridge
3.1 mi
ICW Intersection
3.9 mi
Mile Point LB 20
4.4 mi
Mayport
5.7 mi
Ft. George River
5.9 mi
Drummond Point, channel south of
6.2 mi
Pablo Creek bascule bridge
6.6 mi
St. Johns Bar Cut, 0.7 n.mi. east of jetties
6.7 mi
Mayport Basin Entrance
7.0 mi
Terminal Channel (north end)
7.1 mi
Reddie Point
7.2 mi
St. Johns River Ent. (between jetties)
7.2 mi
Trout River Cut
7.3 mi
Chaseville Turn
8.0 mi
Bar Cut, 0.6 n.mi. ENE of St. John's Point
8.7 mi
Commodore Point, terminal channel
9.8 mi
Midsound, 1 mi. N of Sawpit Creek entrance
9.9 mi
Jacksonville, off Washington St
10.0 mi
Nassau River, SW of Mesa Marsh
10.4 mi
South Amelia River, off Walker Creek
10.5 mi
Acosta Bridge
11.5 mi
Winter Point
About these predictions
Tide heights are predictions, not measurements. Wind, air pressure, storms, and river flow can cause actual water levels to differ. Not for navigation.
Tide prediction source:
NOAA
Vertical datum:
MLLW — Mean Lower Low Water
Add a free tide or fishing times widget for this station to your website.