Anchor Point Weekly Tide Tables and Charts
Tide Chart for Next 7 Days
Anchor Point weekly tide chart key:
The tide chart above shows the times and heights of high tide and low tide for Anchor Point, for the next seven days. The red line highlights the current time and estimated height.The tidal range at Anchor Point for the next seven days is approximately 16.3 ft with a minimum tide of -0.22 ft and maximum tide of 16.08 ft. You can also check out all the daily details on tides & fishing times on the Day tab for Anchor Point.
Tide Table for Next 7 Days
▲ Blue = High Tide
▼ Red = Low Tide
| Day | 1st Tide | 2nd Tide | 3rd Tide | 4th Tide | ☀ Sun |
Major Solunars
|
Minor Solunars
|
|
|---|---|---|---|---|---|---|---|---|
| 2 Sun |
|
▲ 15.81 ft |
▼ -0.22 ft |
▲ 15.93 ft |
▼ 1.65 ft |
▲ 4:55 AM ▼ 9:00 PM |
2:46 AM → 4:46 AM 2:57 PM → 4:57 PM |
9:35 AM → 10:35 AM 9:20 PM → 10:20 PM |
| 3 Mon |
|
▲ 15.1 ft |
▼ 0.6 ft |
▲ 16.08 ft |
▼ 1.44 ft |
▲ 4:57 AM ▼ 8:58 PM |
3:29 AM → 5:29 AM 3:42 PM → 5:42 PM |
10:59 AM → 11:59 AM 9:26 PM → 10:26 PM |
| 4 Tue |
|
▲ 14.17 ft |
▼ 1.67 ft |
▲ 16.06 ft |
▲ 4:59 AM ▼ 8:55 PM |
4:15 AM → 6:15 AM 4:29 PM → 6:29 PM |
12:26 PM → 1:26 PM 9:33 PM → 10:33 PM |
|
| 5 Wed |
|
▼ 1.44 ft |
▲ 13.08 ft |
▼ 2.94 ft |
▲ 15.85 ft |
▲ 5:01 AM ▼ 8:53 PM |
5:05 AM → 7:05 AM 5:21 PM → 7:21 PM |
1:57 PM → 2:57 PM 9:45 PM → 10:45 PM |
| 6 Thu |
|
▼ 1.56 ft |
▲ 12 ft |
▼ 4.26 ft |
▲ 15.56 ft |
▲ 5:03 AM ▼ 8:51 PM |
5:58 AM → 7:58 AM 6:24 PM → 8:24 PM |
3:31 PM → 4:31 PM 10:04 PM → 11:04 PM |
| 7 Fri |
|
▼ 1.5 ft |
▲ 11.29 ft |
▼ 5.3 ft |
▲ 15.39 ft |
▲ 5:05 AM ▼ 8:49 PM |
6:57 AM → 8:57 AM 7:28 PM → 9:28 PM |
5:18 PM → 6:18 PM 10:38 PM → 11:38 PM |
| 8 Sat |
|
▼ 0.91 ft |
▲ 11.35 ft |
▼ 5.54 ft |
▲ 15.64 ft |
▲ 5:07 AM ▼ 8:46 PM |
8:00 AM → 10:00 AM 8:35 PM → 10:35 PM |
6:32 PM → 7:32 PM |
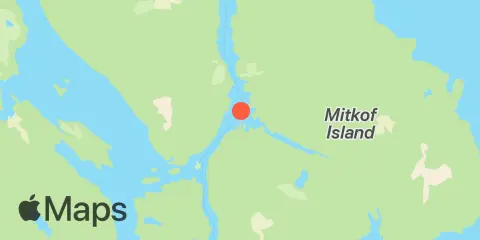
Location & Map
Latitude
56° 38' 18" N (56.6383)
Longitude
132° 55' 37" W (-132.927)
State
County
Nearest ZIP
99833
Nearby
Tides
2.7 mi
Papke's Landing, Wrangell Narrows
3.8 mi
Beecher Pass, Wrangell Narrows
5.7 mi
Point Lockwood, Woewodski Island, Wrangell Narrows
11.3 mi
Ideal Cove, Mitkof Island, Frederick Sound
11.4 mi
Turn Point
11.9 mi
Cosmos Point, Frederick Sound
12.3 mi
Petersburg, Wrangell Narrows
Currents
0.2 mi
Anchor Point
1.4 mi
Vexation Point, Woody Island
1.9 mi
South Ledge
3.2 mi
Spike Rock
4.4 mi
Green Point
5.9 mi
Point Lockwood
6.6 mi
Mountain Point
7.4 mi
Point Deception
8.9 mi
Point Alexander
9.9 mi
Blunt Point
11.9 mi
Turn Point
12.3 mi
Wrangell Narrows (off Petersburg)
Note: Tide predictions are an estimate and NOT FOR NAVIGATION.
We also offer free widgets if you want to add tide or solunar tables to your own site.