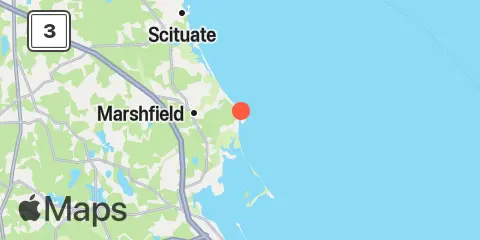
Brant Rock Weekly Tide Tables and Charts
Tide Chart for Next 7 Days
About this chart
Brant Rock weekly tide chart key:
The tide chart above shows the times and heights of high tide and low tide for Brant Rock, for the next seven days. The red line highlights the current time and estimated height.The tidal range at Brant Rock from through is approximately 12.12 ft, with a minimum tide of -1.07 ft and maximum tide of 11.05 ft. You can also check out all the daily details on tides & fishing times on the Day tab for Brant Rock.
Tide Table for Next 7 Days
▲ Blue = High Tide
▼ Red = Low Tide
| Day | Moon phase | 1st Tide | 2nd Tide | 3rd Tide | 4th Tide | ☀ Sun |
Major Times

|
Minor Times

|
|---|---|---|---|---|---|---|---|---|
 95% |
▲ 9.55 ft |
▼ 0.26 ft |
▲ 11.05 ft |
▼ -1.07 ft |
▲ 7:11 AM ▼ 5:42 PM |
1:16 AM → 3:16 AM 1:45 PM → 3:45 PM |
9:50 AM → 10:50 AM 6:41 PM → 7:41 PM |
|
|
89%
|
▲ 9.46 ft |
▼ 0.3 ft |
▲ 11.05 ft |
▼ -0.97 ft |
▲ 7:12 AM ▼ 5:40 PM |
2:20 AM → 4:20 AM 2:51 PM → 4:51 PM |
11:01 AM → 12:01 PM 7:42 PM → 8:42 PM |
|
|
81%
|
▲ 9.3 ft |
▼ 0.44 ft |
▲ 10.87 ft |
▼ -0.73 ft |
▲ 7:13 AM ▼ 5:39 PM |
3:24 AM → 5:24 AM 3:57 PM → 5:57 PM |
12:02 PM → 1:02 PM 8:53 PM → 9:53 PM |
|
|
71%
|
▲ 9.1 ft |
▼ 0.64 ft |
▲ 10.56 ft |
▼ -0.43 ft |
▲ 7:14 AM ▼ 5:38 PM |
4:26 AM → 6:26 AM 4:59 PM → 6:59 PM |
12:49 PM → 1:49 PM 10:10 PM → 11:10 PM |
|
 50% |
▲ 8.95 ft |
▼ 0.82 ft |
▲ 10.2 ft |
▼ -0.13 ft |
▲ 6:15 AM ▼ 4:36 PM |
4:24 AM → 6:24 AM 4:56 PM → 6:56 PM |
12:26 PM → 1:26 PM 10:26 PM → 11:26 PM |
|
 48% |
▲ 8.92 ft |
▼ 0.91 ft |
▲ 9.87 ft |
▼ 0.09 ft |
▲ 6:17 AM ▼ 4:35 PM |
5:18 AM → 7:18 AM 5:48 PM → 7:48 PM |
12:56 PM → 1:56 PM | |
|
37%
|
▲ 9.07 ft |
▼ 0.85 ft |
▲ 9.65 ft |
▲ 6:18 AM ▼ 4:34 PM |
6:06 AM → 8:06 AM 6:35 PM → 8:35 PM |
11:40 PM → 12:40 AM 1:20 PM → 2:20 PM |
About these predictions
Tide heights are predictions, not measurements. Wind, air pressure, storms, and river flow can cause actual water levels to differ. Not for navigation.
Tide prediction source:
NOAA
Vertical datum:
MLLW — Mean Lower Low Water
Add a free tide or fishing times widget for this station to your website.