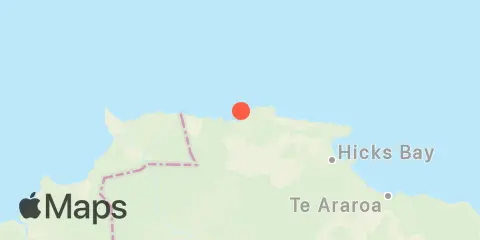
Lottin Point / Wakatiri Weekly Tide Tables and Charts
Tide Chart for Next 7 Days
About this chart
Lottin Point / Wakatiri weekly tide chart key:
The tide chart above shows the times and heights of high tide and low tide for Lottin Point / Wakatiri, for the next seven days. The red line highlights the current time and estimated height.The tidal range at Lottin Point / Wakatiri from through is approximately 1.9 m, with a minimum tide of 0.1 m and maximum tide of 2 m. You can also check out all the daily details on tides & fishing times on the Day tab for Lottin Point / Wakatiri.
Tide Table for Next 7 Days
| Day | Moon phase | 1st Tide | 2nd Tide | 3rd Tide | 4th Tide | ☀ Sun |
Major Times

|
Minor Times

|
|---|---|---|---|---|---|---|---|---|
 94% |
▲ 1.6 m |
▼ 0.5 m |
▲ 1.7 m |
▲ 6:11 AM ▼ 7:32 PM |
9:57 AM → 11:57 AM 10:20 PM → 12:20 AM |
4:11 AM → 5:11 AM 4:54 PM → 5:54 PM |
||
|
98%
|
▼ 0.4 m |
▲ 1.7 m |
▼ 0.4 m |
▲ 1.8 m |
▲ 6:09 AM ▼ 7:33 PM |
10:44 AM → 12:44 PM |
4:37 AM → 5:37 AM 6:03 PM → 7:03 PM |
|
 100% |
▼ 0.3 m |
▲ 1.8 m |
▼ 0.4 m |
▲ 1.9 m |
▲ 6:08 AM ▼ 7:34 PM |
11:09 PM → 1:09 AM 11:34 AM → 1:34 PM |
5:05 AM → 6:05 AM 7:16 PM → 8:16 PM |
|
 99% |
▼ 0.2 m |
▲ 1.9 m |
▼ 0.3 m |
▲ 1.9 m |
▲ 6:07 AM ▼ 7:35 PM |
12:01 AM → 2:01 AM 12:29 PM → 2:29 PM |
5:38 AM → 6:38 AM 8:32 PM → 9:32 PM |
|
|
95%
|
▼ 0.1 m |
▲ 2 m |
▼ 0.3 m |
▲ 1.9 m |
▲ 6:06 AM ▼ 7:36 PM |
12:58 AM → 2:58 AM 1:29 PM → 3:29 PM |
6:19 AM → 7:19 AM 9:48 PM → 10:48 PM |
|
|
89%
|
▼ 0.1 m |
▲ 2 m |
▼ 0.3 m |
▲ 1.9 m |
▲ 6:04 AM ▼ 7:37 PM |
2:00 AM → 4:00 AM 2:32 PM → 4:32 PM |
7:09 AM → 8:09 AM 10:59 PM → 11:59 PM |
|
|
81%
|
▼ 0.1 m |
▲ 2 m |
▼ 0.3 m |
▲ 1.9 m |
▲ 6:03 AM ▼ 7:38 PM |
3:05 AM → 5:05 AM 3:37 PM → 5:37 PM |
8:10 AM → 9:10 AM |
About these predictions
Tide heights are predictions, not measurements. Wind, air pressure, storms, and river flow can cause actual water levels to differ. Not for navigation.
Tide prediction source:
This work includes Toitū Te Whenua Land Information New Zealand data which are licensed by Toitū Te Whenua Land Information New Zealand for re-use under the Creative Commons Attribution 4.0 International licence ( license details
). Heights converted from metres to feet; predictions grouped by local date. Crown copyright. Official source
Vertical datum:
CD — Chart Datum (LINZ)
Add a free tide or fishing times widget for this station to your website.