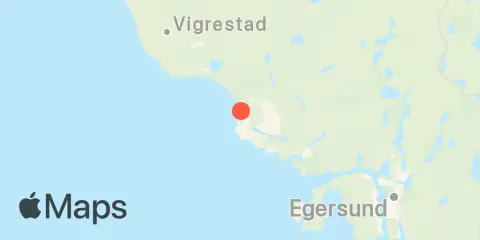
Sirevåg 週間潮汐表とグラフ
今後7日間の潮汐グラフ
About this chart
Sirevågの週間潮汐グラフの見方:
上の潮汐グラフは、Sirevågの今後7日間の満潮・干潮の時刻と潮位を示しています。赤い線は現在時刻と推定潮位を示します。Sirevågのからまで(両日を含む)の潮差は約0.21 mで、最低潮位は0.41 m、最高潮位は0.61 mです。 こちらもご利用いただけます: 「日」タブでSirevågの日ごとの潮汐と釣りの時間の詳細を確認.
今後7日間の潮汐表
| 日 | 月相 | 1st 潮汐 | 2nd 潮汐 | 3rd 潮汐 | 4th 潮汐 | ☀ 太陽 |
主要時間

|
副次時間

|
|---|---|---|---|---|---|---|---|---|
 96% |
▼ 0.45 m |
▲ 0.55 m |
▼ 0.46 m |
▲ 0.57 m |
▲ 08:33 ▼ 18:07 |
10:49 → 12:49 |
05:38 → 06:38 16:40 → 17:40 |
|
|
99%
|
▼ 0.42 m |
▲ 0.57 m |
▼ 0.44 m |
▲ 0.6 m |
▲ 07:36 ▼ 17:04 |
23:13 → 01:13 10:37 → 12:37 |
06:12 → 07:12 15:45 → 16:45 |
|
 100% |
▼ 0.41 m |
▲ 0.59 m |
▼ 0.42 m |
▲ 0.61 m |
▲ 07:38 ▼ 17:02 |
23:03 → 01:03 11:30 → 13:30 |
07:53 → 08:53 15:51 → 16:51 |
|
 98% |
▼ 0.41 m |
▲ 0.6 m |
▼ 0.42 m |
▲ 0.61 m |
▲ 07:40 ▼ 16:59 |
23:58 → 01:58 12:27 → 14:27 |
09:39 → 10:39 16:03 → 17:03 |
|
|
93%
|
▼ 0.42 m |
▲ 0.6 m |
▼ 0.43 m |
▲ 0.61 m |
▲ 07:43 ▼ 16:57 |
00:57 → 02:57 13:28 → 15:28 |
11:24 → 12:24 16:26 → 17:26 |
|
|
85%
|
▼ 0.44 m |
▲ 0.6 m |
▼ 0.45 m |
▲ 07:45 ▼ 16:54 |
02:00 → 04:00 14:33 → 16:33 |
12:51 → 13:51 17:14 → 18:14 |
||
|
76%
|
▲ 0.59 m |
▼ 0.46 m |
▲ 0.58 m |
▼ 0.47 m |
▲ 07:47 ▼ 16:52 |
03:05 → 05:05 15:37 → 17:37 |
13:46 → 14:46 18:33 → 19:33 |
この潮汐予測について
潮位は予測値であり、実測値ではありません。風、気圧、嵐、河川流量によって実際の水位が異なることがあります。航海用ではありません。
潮汐予測の出典:
Source: Kartverket – Norwegian Mapping Authority, Hydrographic Service, CC BY 4.0 ( ライセンスの詳細
). Astronomical tide predictions; heights converted from centimeters to feet; dates grouped in Europe/Oslo. Derived from Kartverket astronomical predictions sampled every 10 minutes. Turning points use an actual sample at the middle of a rounded plateau (earlier middle sample if even); times are approximate. Matching published table events retain their original times and heights. Includes estimated turning points within rounded flat portions of the official prediction curve; these are not published Kartverket high/low events. 公式情報源
高さの基準面:
CD — Chart Datum (Kartverket)