Richardson Wöchentliche Gezeitentabellen und -diagramme
Gezeitendiagramm für die nächsten 7 Tage
Legende zum wöchentlichen Gezeitendiagramm für Richardson:
Das Gezeitendiagramm oben zeigt Zeiten und Höhen von Hoch- und Niedrigwasser für Richardson in den nächsten sieben Tagen. Die rote Linie markiert die aktuelle Zeit und die geschätzte Wasserhöhe.Der Tidenhub in Richardson in den nächsten sieben Tagen beträgt ungefähr 7.66 ft, bei einem niedrigsten Wasserstand von -0.59 ft und einem höchsten Wasserstand von 7.07 ft. Sie können auch alle täglichen Details zu Gezeiten und Angelzeiten auf der Registerkarte „Tag“ für Richardson ansehen.
Gezeitentabelle für die nächsten 7 Tage
▲ Blau = Hochwasser
▼ Rot = Niedrigwasser
| Tag | Mondphase | 1st Gezeit | 2nd Gezeit | 3rd Gezeit | 4th Gezeit | ☀ Sonne |
Große Solunarperioden

|
Kleine Solunarperioden

|
|---|---|---|---|---|---|---|---|---|
| 9 Fr |
 3%
3%
|
▲ 5.67 ft |
▼ 2.25 ft |
▲ 6.97 ft |
▼ 1.32 ft |
▲ 07:23 ▼ 18:34 |
23:00 → 01:00 11:15 → 13:15 |
05:51 → 06:51 17:24 → 18:24 |
| 10 Sa |
 0%
0%
|
▲ 5.96 ft |
▼ 3.21 ft |
▲ 7.05 ft |
▼ 0.46 ft |
▲ 07:24 ▼ 18:32 |
23:44 → 01:44 11:59 → 13:59 |
07:05 → 08:05 17:41 → 18:41 |
| 11 So |
 1%
1%
|
▲ 6.28 ft |
▼ 4.15 ft |
▲ 7.07 ft |
▼ -0.16 ft |
▲ 07:26 ▼ 18:30 |
00:30 → 02:30 12:45 → 14:45 |
08:19 → 09:19 17:59 → 18:59 |
| 12 Mo |
2%
|
▲ 6.59 ft |
▼ 4.99 ft |
▲ 6.99 ft |
▼ -0.51 ft |
▲ 07:27 ▼ 18:28 |
01:15 → 03:15 13:32 → 15:32 |
09:32 → 10:32 18:22 → 19:22 |
| 13 Di |
6%
|
▲ 6.82 ft |
▼ 5.67 ft |
▲ 6.81 ft |
▲ 07:29 ▼ 18:26 |
02:02 → 04:02 14:21 → 16:21 |
10:43 → 11:43 18:51 → 19:51 |
|
| 14 Mi |
11%
|
▼ -0.59 ft |
▲ 6.96 ft |
▼ 6.15 ft |
▲ 6.58 ft |
▲ 07:30 ▼ 18:24 |
02:51 → 04:51 15:12 → 17:12 |
11:51 → 12:51 19:28 → 20:28 |
| 15 Do |
18%
|
▼ -0.45 ft |
▲ 7.01 ft |
▲ 07:32 ▼ 18:22 |
03:39 → 05:39 16:03 → 18:03 |
12:50 → 13:50 20:14 → 21:14 |
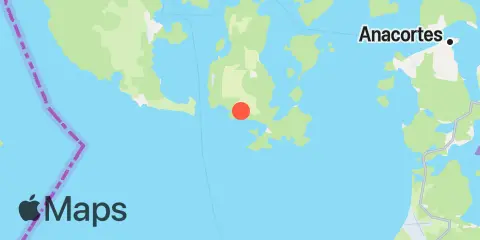
Ort und Karte
Breitengrad
48° 26' 48" N (48.4467)
Längengrad
122° 54' 0" W (-122.9)
Bundesstaat
County
Nächstgelegene US-Postleitzahl
98261
In der Nähe
Gezeiten
2.6 mi
Aleck Bay, Lopez Island
4.4 mi
Telegraph Bay
7.7 mi
Armitage Island, Thatcher Pass
8.6 mi
Friday Harbor, San Juan Island, San Juan Channel
8.7 mi
Upright Head, Lopez Island
8.8 mi
Kanaka Bay, San Juan Island, Haro Strait
9.4 mi
Smith Island, Strait of Juan de Fuca
9.4 mi
Burrows Bay (Allan Island)
9.6 mi
Shaw Island, Ferry Terminal, Harney Channel, San Juan Channel
10.8 mi
Orcas, Orcas Island
11.0 mi
Ship Harbor, Fidalgo Island
11.5 mi
Peavine Pass
11.6 mi
Strawberry Bay, Cypress Island
11.6 mi
Deception Pass St. Park, Bowman Bay, Fidalgo I.
11.9 mi
Tide Point, Cypress Island
12.2 mi
Naval Air Station Whidbey Island
Strömungen
2.3 mi
Cattle Point, 1.2 nm SE of
2.6 mi
San Juan Channel, south entrance
3.6 mi
Kings Point, Lopez Island, 1 mile NNW of
4.4 mi
Lopez Pass
4.4 mi
Iceberg Point, 2.1 miles SSW of
5.0 mi
Colville Island, 1 mile SSE of
5.1 mi
Pear Point, east of
5.6 mi
Cattle Point, 2.8 miles SSW of
5.8 mi
Point Colville, 1.4 nm east of
6.9 mi
Cattle Point, 4.6 nm SW of
6.9 mi
Rosario Strait
7.1 mi
Thatcher Pass
7.1 mi
Frost-Willow Island, between
7.5 mi
Upright Channel narrows
7.7 mi
Point Colville, 3.0 nm east of (Lawson Reef, 1 nm
7.9 mi
Fauntleroy Point Light, east of
8.5 mi
Belle Rock Light, east of
8.8 mi
Point George, west of
9.0 mi
Smith Island, 5.5 mi. WNW of
9.3 mi
Allan Pass
9.7 mi
Green Point, 0.8 mile northwest of
9.9 mi
Harney Channel, north of Point Hudson
10.0 mi
Burrows Bay, 0.5 mile east of Allan I
10.2 mi
Burrows Pass
10.3 mi
Strawberry Island, west of
10.4 mi
Peavine Pass, west entrance
10.4 mi
Smith Island, 1.4 miles SSW of
10.9 mi
Wasp Passage narrows
11.5 mi
Obstruction Pass, north of Obstruction Island
11.7 mi
Discovery Island, 3.0 nm NE of
11.8 mi
Bellingham Channel South
11.8 mi
Smith Island, 3.4 mi. ESE of
12.1 mi
Deception Pass (Narrows)
Quelle der Gezeitenvorhersagen:
NOAA
Höhenbezug:
MLLW — Mean Lower Low Water
Hinweis: Gezeitenvorhersagen sind Schätzungen und NICHT ZUR NAVIGATION GEEIGNET.
Kostenlose Widgets stehen ebenfalls zur Verfügung, um Gezeiten- oder Solunartabellen auf Ihrer eigenen Website einzubinden.